Crimson Rosella
Platycercus elegans
ABR description
The following is extracted from the Annual Bird Report for the twelve months to June 2017.
Very common, breeding resident
An attractive common resident of the COG area of interest.
General: Reporting rate (37.8%) is 15% lower than last year and 21% below the 30YA. From 1991 to 1998, the reporting rate was steady between 20% and 40%. In 1999, it rose to 53% and since then has then declined to 44% last year with a further decline to 38% th is year. Average 4.8, median 3 with max 98/12 Jun Campbell Pk GrM13 (SmA1). Recorded in all seasons but highest in spring (28%). Breeding: 88 records (65 last year) first ih/14 Jul Coolemon Ridge GrI15 (HoJ1) and last dy/19 Feb Campbell Park (BuM4) with a very early display di/20 May Yass Gorge GrF03 (SeB1). Crimson Rosella/Eastern Rosella hybrid reported from West Macgregor 1/25 Jun Ainslie GrL13 (HoS1). Yellow Rosella last reported 2014-15.
GBS: 8th most abundant species recorded in GBS (6th last year). Records from 59 sites from all weeks with almost no seasonal variation: Average 3.6, median 3 with max 25/4 wk Jun Jerrabomberra GrM16 (HaL2). Abundance 6% lower than last year and 10% lower than the 30YA. The A value for this species climbed steadily from A=2.0069 in 1982 to A=3.9689 in 1998. It remained around that value until 2006, and from then has declined to A=2.9942 in 2016-17. Breeding recorded from 14 sites: earliest ih/3 wk Jul Kambah Gr J16 (VeP1) and ih/3 wk Jul Red Hill GrK14 (WaR4); latest dy/3 Feb Florey (BrJ3) with any number of “inspecting hollows” to the end of the year, the last being ih/4 wk Jun Kambah Gr J16 (VeP1). Crimson Rosella/Eastern Rosella hybrid reported from two sites in Curtin and Deakin. Yellow Rosella last reported 2010-11.

Abundance
Abundance is the average number of birds of that species per survey. Where the species was observed (presence recorded) but the number of birds seen was not recorded, this is treated as a count of zero.
Abundance by year
This chart shows the abundance of Crimson Rosella between 1982 and 2017. 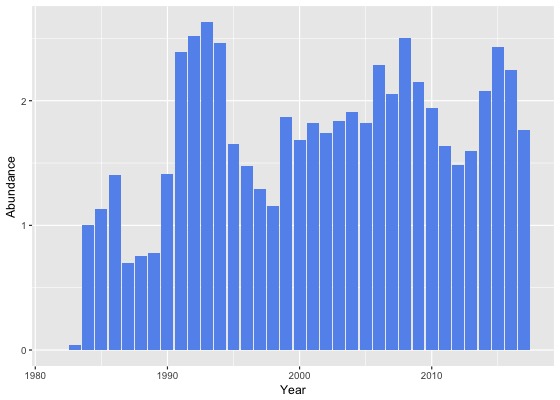
Abundance by month
This chart shows the monthly abundance of Crimson Rosella. The blue lines show the abundance for the twelve months to June 2017 and the bars show the average abundance for the period 1982 to 2017. 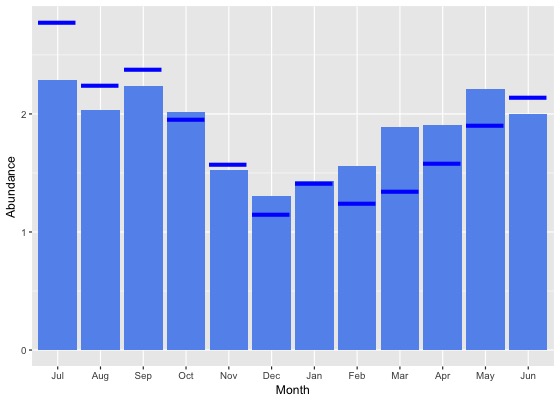
Abundance by season
This chart shows the seasonal abundance of Crimson Rosella. The blue lines show the seasonal abundance for the twelve months to June 2017 and the bars show the average seasonal abundance for the period 1982 to 2017. 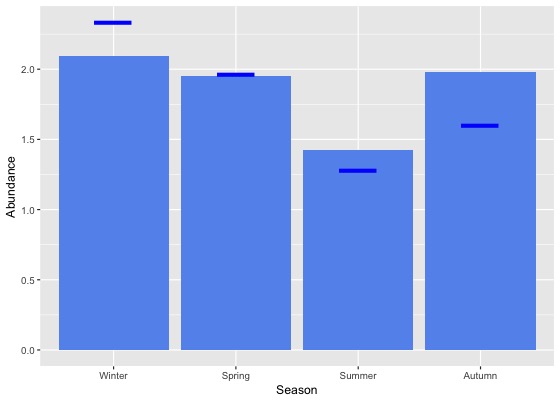
Abundance data
| Month | Season | ||||||||||||||||||
|---|---|---|---|---|---|---|---|---|---|---|---|---|---|---|---|---|---|---|---|
| Period | Jul | Aug | Sep | Oct | Nov | Dec | Jan | Feb | Mar | Apr | May | Jun | Winter | Spring | Summer | Autumn | All | ||
| All years | |||||||||||||||||||
| All | 2.3 | 2.0 | 2.2 | 2.0 | 1.5 | 1.3 | 1.4 | 1.6 | 1.9 | 1.9 | 2.2 | 2.0 | 2.1 | 1.9 | 1.4 | 2.0 | 1.9 | ||
| Previous years | |||||||||||||||||||
| All previous years | 2.2 | 2.0 | 2.2 | 2.0 | 1.5 | 1.3 | 1.4 | 1.6 | 2.0 | 2.0 | 2.3 | 2.0 | 2.0 | 1.9 | 1.4 | 2.0 | 1.9 | ||
| Previous 30 years | 2.2 | 2.0 | 2.2 | 2.0 | 1.5 | 1.3 | 1.4 | 1.6 | 2.0 | 2.0 | 2.3 | 2.0 | 2.1 | 2.0 | 1.5 | 2.1 | 1.9 | ||
| Previous 20 years | 2.4 | 2.2 | 2.4 | 2.2 | 1.7 | 1.4 | 1.5 | 1.8 | 2.1 | 2.0 | 2.4 | 2.1 | 2.2 | 2.1 | 1.5 | 2.1 | 2.0 | ||
| 10 year groups | |||||||||||||||||||
| [2007,2017) | 2.6 | 2.4 | 2.5 | 2.3 | 1.7 | 1.5 | 1.5 | 1.8 | 2.1 | 2.0 | 2.5 | 2.2 | 2.4 | 2.2 | 1.6 | 2.2 | 2.1 | ||
| [1997,2007) | 2.2 | 1.9 | 2.3 | 1.8 | 1.5 | 1.2 | 1.5 | 1.6 | 2.1 | 2.0 | 2.2 | 1.7 | 1.9 | 1.9 | 1.4 | 2.1 | 1.8 | ||
| [1987,1997) | 1.5 | 1.4 | 1.3 | 1.3 | 1.1 | 1.0 | 1.3 | 1.1 | 1.4 | 1.7 | 1.8 | 1.5 | 1.5 | 1.2 | 1.1 | 1.6 | 1.4 | ||
| 5 year groups | |||||||||||||||||||
| [2012,2017) | 2.6 | 2.5 | 2.4 | 2.2 | 1.6 | 1.6 | 1.4 | 1.8 | 2.2 | 2.2 | 2.7 | 2.4 | 2.5 | 2.1 | 1.6 | 2.3 | 2.1 | ||
| [2007,2012) | 2.6 | 1.8 | 2.8 | 2.4 | 2.2 | 1.4 | 1.7 | 1.8 | 1.9 | 1.6 | 2.1 | 1.9 | 2.0 | 2.5 | 1.6 | 1.8 | 2.0 | ||
| [2002,2007) | 2.4 | 2.0 | 2.6 | 1.9 | 1.7 | 1.2 | 1.4 | 1.6 | 2.3 | 2.2 | 2.1 | 1.7 | 2.0 | 2.1 | 1.3 | 2.2 | 1.9 | ||
| [1997,2002) | 1.7 | 1.8 | 1.9 | 1.7 | 1.3 | 1.2 | 1.6 | 1.6 | 1.8 | 1.8 | 2.4 | 1.7 | 1.7 | 1.6 | 1.4 | 1.9 | 1.7 | ||
| [1992,1997) | 2.7 | 2.3 | 2.0 | 2.4 | 1.8 | 1.5 | 2.1 | 1.3 | 2.0 | 2.1 | 2.7 | 2.0 | 2.3 | 2.1 | 1.6 | 2.2 | 2.1 | ||
| [1987,1992) | 1.0 | 1.0 | 0.9 | 0.8 | 0.7 | 0.7 | 0.9 | 1.0 | 1.0 | 1.5 | 1.4 | 1.2 | 1.1 | 0.8 | 0.9 | 1.3 | 1.0 | ||
| Year | |||||||||||||||||||
| 2017 | 2.8 | 2.2 | 2.4 | 2.0 | 1.6 | 1.2 | 1.4 | 1.2 | 1.3 | 1.6 | 1.9 | 2.1 | 2.3 | 2.0 | 1.3 | 1.6 | 1.8 | ||
| 2016 | 2.9 | 2.6 | 2.7 | 2.2 | 1.9 | 1.9 | 1.7 | 1.8 | 2.4 | 2.4 | 2.5 | 2.6 | 2.7 | 2.3 | 1.8 | 2.4 | 2.2 | ||
| 2015 | 2.3 | 3.6 | 3.1 | 2.8 | 1.5 | 1.8 | 1.8 | 2.6 | 1.8 | 2.6 | 3.1 | 2.8 | 2.9 | 2.5 | 2.0 | 2.4 | 2.4 | ||
| 2014 | 2.8 | 2.0 | 1.9 | 2.2 | 1.8 | 1.6 | 1.3 | 1.8 | 2.7 | 2.4 | 2.9 | 2.3 | 2.3 | 2.0 | 1.5 | 2.7 | 2.1 | ||
| 2013 | 2.3 | 1.9 | 1.7 | 1.9 | 1.4 | 1.1 | 0.9 | 0.9 | 2.0 | 1.4 | 3.0 | 2.1 | 2.1 | 1.7 | 1.0 | 2.0 | 1.6 | ||
| 2012 | 2.4 | 1.3 | 1.5 | 1.6 | 1.2 | 1.3 | 0.7 | 0.9 | 2.0 | 1.9 | 1.4 | 1.8 | 1.8 | 1.5 | 1.0 | 1.8 | 1.5 | ||
| 2011 | 2.5 | 2.1 | 2.7 | 2.4 | 1.8 | 1.0 | 1.3 | 1.2 | 1.2 | 1.4 | 1.1 | 1.6 | 1.9 | 2.4 | 1.1 | 1.2 | 1.6 | ||
| 2010 | 2.4 | 1.7 | 2.1 | 2.6 | 2.0 | 1.6 | 1.2 | 1.6 | 2.0 | 1.2 | 2.9 | 1.7 | 1.8 | 2.4 | 1.4 | 1.8 | 1.9 | ||
| 2009 | 3.5 | 1.9 | 3.2 | 2.4 | 2.2 | 1.4 | 2.1 | 1.8 | 2.3 | 1.3 | 1.2 | 1.8 | 2.3 | 2.5 | 1.7 | 1.6 | 2.2 | ||
| 2008 | 2.4 | 2.3 | 3.4 | 2.4 | 2.9 | 1.5 | 2.8 | 2.6 | 2.4 | 2.2 | 3.4 | 2.4 | 2.4 | 2.7 | 2.2 | 2.4 | 2.5 | ||
| 2007 | 2.2 | 1.2 | 2.7 | 2.3 | 2.2 | 1.5 | 1.8 | 2.6 | 1.9 | 1.5 | 3.5 | 1.9 | 1.8 | 2.4 | 1.8 | 2.1 | 2.1 | ||
| 2006 | 3.0 | 2.2 | 2.9 | 3.1 | 2.2 | 1.2 | 1.6 | 1.4 | 2.4 | 2.5 | 1.8 | 1.9 | 2.3 | 2.8 | 1.4 | 2.3 | 2.3 | ||
| 2005 | 2.8 | 1.1 | 2.5 | 0.9 | 1.8 | 1.5 | 1.3 | 1.4 | 2.1 | 1.5 | 2.0 | 2.1 | 2.1 | 1.9 | 1.4 | 1.9 | 1.8 | ||
| 2004 | 2.2 | 1.7 | 2.8 | 2.1 | 1.8 | 0.9 | 1.7 | 1.2 | 2.2 | 2.0 | 2.7 | 1.4 | 1.8 | 2.3 | 1.3 | 2.2 | 1.9 | ||
| 2003 | 2.1 | 2.4 | 2.1 | 1.2 | 1.1 | 1.1 | 1.0 | 2.1 | 2.6 | 2.9 | 2.4 | 1.3 | 1.9 | 1.5 | 1.4 | 2.6 | 1.8 | ||
| 2002 | 2.2 | 2.6 | 2.7 | 1.1 | 1.9 | 1.1 | 1.1 | 1.5 | 2.2 | 1.7 | 1.9 | 1.6 | 2.1 | 1.9 | 1.2 | 1.9 | 1.7 | ||
| 2001 | 1.9 | 1.7 | 2.1 | 1.5 | 1.3 | 1.7 | 1.8 | 1.7 | 1.8 | 2.0 | 2.5 | 1.9 | 1.9 | 1.7 | 1.8 | 2.0 | 1.8 | ||
| 2000 | 1.8 | 2.0 | 2.0 | 1.6 | 1.5 | 0.9 | 1.2 | 1.6 | 2.0 | 2.0 | 2.1 | 2.4 | 2.1 | 1.7 | 1.2 | 2.0 | 1.7 | ||
| 1999 | 1.1 | 1.7 | 1.9 | 1.7 | 1.5 | 1.4 | 2.5 | 2.2 | 1.9 | 1.6 | 2.7 | 1.8 | 1.7 | 1.7 | 2.0 | 2.1 | 1.9 | ||
| 1998 | 0.5 | 1.3 | 2.1 | 2.5 | 0.9 | 0.6 | 1.3 | 0.8 | 0.5 | 0.5 | 1.7 | 0.5 | 0.7 | 1.8 | 0.9 | 0.7 | 1.2 | ||
| 1997 | 1.5 | 2.4 | 0.7 | 1.9 | 1.1 | 0.6 | 1.2 | 0.6 | 3.1 | 1.8 | 1.7 | 0.2 | 1.3 | 1.1 | 0.8 | 2.1 | 1.3 | ||
| 1996 | 2.2 | 1.3 | 2.0 | 1.3 | 1.4 | 1.4 | 1.5 | 1.0 | 1.0 | 2.0 | 1.3 | 1.9 | 1.7 | 1.5 | 1.3 | 1.3 | 1.5 | ||
| 1995 | 3.3 | 1.2 | 0.9 | 2.3 | 0.7 | 1.1 | 1.7 | 0.7 | 1.6 | 1.6 | 2.2 | 2.2 | 2.1 | 1.5 | 1.3 | 1.7 | 1.7 | ||
| 1994 | 1.9 | 3.5 | 2.1 | 4.3 | 2.1 | 2.7 | 4.5 | 1.3 | 1.6 | 1.4 | 2.1 | 2.7 | 2.8 | 2.7 | 2.9 | 1.7 | 2.5 | ||
| 1993 | 2.3 | 4.0 | 2.5 | 1.9 | 2.6 | 1.6 | 2.1 | 1.8 | 3.6 | 3.0 | 2.8 | 1.9 | 2.9 | 2.3 | 1.9 | 3.2 | 2.6 | ||
| 1992 | 3.1 | 2.4 | 2.8 | 2.5 | 2.6 | 1.3 | 0.7 | 2.3 | 2.5 | 3.7 | 4.8 | 0.7 | 2.1 | 2.7 | 1.3 | 3.7 | 2.5 | ||
| 1991 | 2.2 | 2.2 | 2.9 | 1.5 | 1.8 | 1.1 | 3.4 | 4.0 | 1.7 | 3.1 | 3.1 | 3.8 | 2.5 | 2.0 | 2.6 | 2.6 | 2.4 | ||
| 1990 | 0.7 | 0.6 | 0.5 | 0.3 | 0.3 | 0.4 | 0.6 | 0.7 | 2.7 | 5.1 | 4.6 | 2.8 | 1.0 | 0.4 | 0.6 | 4.1 | 1.4 | ||
| 1989 | 0.7 | 0.9 | 0.8 | 0.7 | 0.6 | 0.7 | 0.7 | 0.9 | 0.7 | 0.8 | 0.8 | 1.0 | 0.9 | 0.7 | 0.8 | 0.8 | 0.8 | ||
| 1988 | 0.7 | 0.9 | 0.7 | 0.7 | 0.6 | 0.8 | 0.7 | 0.9 | 0.8 | 0.9 | 0.8 | 0.8 | 0.8 | 0.7 | 0.8 | 0.8 | 0.8 | ||
| 1987 | 1.0 | 0.2 | 0.7 | 0.8 | 0.6 | 0.7 | 0.6 | 0.7 | 0.7 | 0.7 | 0.7 | 0.8 | 0.7 | 0.7 | 0.7 | 0.7 | 0.7 | ||
| 1986 | 0.8 | 1.3 | 0.8 | 1.1 | 0.9 | 0.9 | 0.6 | 1.4 | 1.1 | 2.8 | 1.4 | 3.2 | 1.8 | 0.9 | 1.0 | 1.9 | 1.4 | ||
| 1985 | 2.8 | 0.7 | 0.9 | 0.8 | 1.0 | 1.1 | 0.1 | 1.1 | 0.6 | 1.8 | 0.4 | 1.9 | 1.8 | 0.9 | 1.0 | 1.1 | 1.1 | ||
| 1984 | 0.0 | 0.0 | 0.0 | 0.0 | 0.0 | 0.0 | 1.4 | 0.5 | 3.2 | 0.7 | 1.8 | 0.4 | 0.3 | 0.0 | 0.8 | 1.8 | 1.0 | ||
| 1983 | 0.0 | 0.0 | 0.0 | 0.1 | 0.1 | 0.1 | 0.0 | 0.1 | 0.0 | - | 0.0 | 0.0 | 0.0 | 0.1 | 0.1 | 0.0 | 0.0 | ||
| 1982 | - | 0.0 | - | 0.0 | 0.0 | 0.0 | - | 0.0 | - | 0.0 | - | 0.0 | 0.0 | 0.0 | 0.0 | 0.0 | 0.0 | ||
Reporting rates
Reporting rate is the proportion of all surveys in which the species was present.
Reporting rate by year
This chart shows the reporting rate of Crimson Rosella each year between 1982 and 2017. 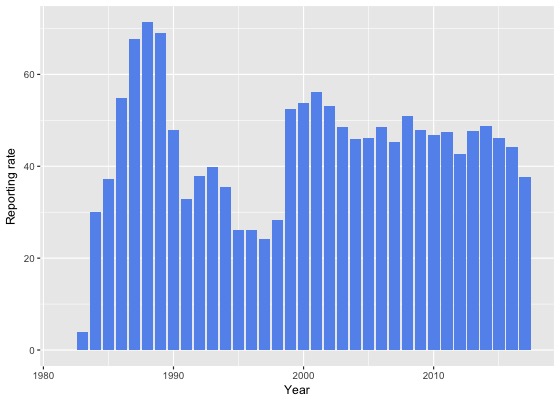
Reporting rate by month
This chart shows the reporting rate by month of Crimson Rosella. The blue lines show the reporting rate for the twelve months to June 2017 and the bars show the average reporting rate for the period 1982 to 2017. 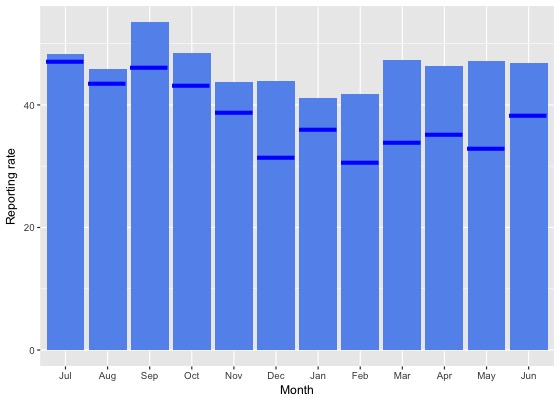
Reporting rate by season
This chart shows the seasonal reporting rate of Crimson Rosella. The blue lines show the seasonal reporting rate for the twelve months to June 2017 and the bars show the average seasonal reporting rate for the period 1982 to 2017. 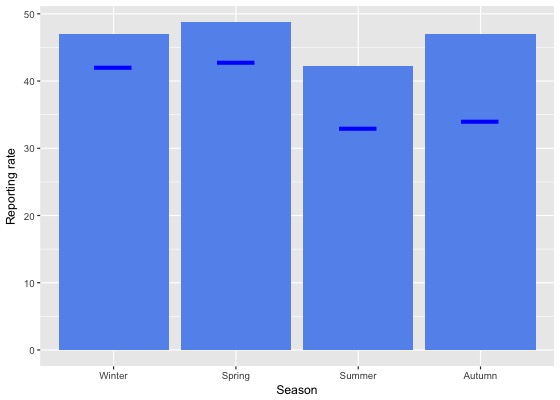
Reporting rate data
| Month | Season | ||||||||||||||||||
|---|---|---|---|---|---|---|---|---|---|---|---|---|---|---|---|---|---|---|---|
| Period | Jul | Aug | Sep | Oct | Nov | Dec | Jan | Feb | Mar | Apr | May | Jun | Winter | Spring | Summer | Autumn | All | ||
| All years | |||||||||||||||||||
| All | 48.4 | 45.8 | 53.5 | 48.4 | 43.8 | 43.8 | 41.1 | 41.8 | 47.3 | 46.4 | 47.1 | 46.8 | 47.0 | 48.7 | 42.3 | 46.9 | 46.3 | ||
| Previous years | |||||||||||||||||||
| All previous years | 48.6 | 46.3 | 54.5 | 49.1 | 44.6 | 45.7 | 42.1 | 44.2 | 49.6 | 48.2 | 50.5 | 48.4 | 47.8 | 49.6 | 44.0 | 49.3 | 47.7 | ||
| Previous 30 years | 48.6 | 46.7 | 54.8 | 49.4 | 44.7 | 46.0 | 42.1 | 44.5 | 49.5 | 48.3 | 50.6 | 48.7 | 48.1 | 49.8 | 44.2 | 49.3 | 47.9 | ||
| Previous 20 years | 47.2 | 46.0 | 54.6 | 49.1 | 42.8 | 45.1 | 40.4 | 42.9 | 48.9 | 46.9 | 48.1 | 48.1 | 47.3 | 49.2 | 42.8 | 48.0 | 46.9 | ||
| 10 year groups | |||||||||||||||||||
| [2007,2017) | 47.5 | 45.3 | 54.0 | 49.2 | 42.4 | 44.7 | 39.9 | 41.5 | 47.9 | 45.4 | 46.3 | 48.2 | 47.2 | 49.0 | 41.9 | 46.6 | 46.2 | ||
| [1997,2007) | 46.8 | 47.3 | 55.7 | 48.6 | 43.7 | 46.0 | 42.3 | 46.8 | 51.2 | 50.8 | 52.4 | 48.1 | 47.4 | 49.8 | 45.1 | 51.4 | 48.5 | ||
| [1987,1997) | 53.4 | 48.8 | 55.6 | 51.1 | 50.7 | 50.9 | 51.6 | 51.9 | 52.8 | 55.5 | 59.9 | 51.7 | 51.2 | 52.3 | 51.5 | 56.0 | 52.7 | ||
| 5 year groups | |||||||||||||||||||
| [2012,2017) | 48.2 | 47.2 | 52.2 | 47.8 | 41.6 | 45.4 | 39.6 | 40.6 | 46.5 | 46.1 | 46.2 | 48.1 | 47.8 | 47.6 | 41.6 | 46.3 | 45.6 | ||
| [2007,2012) | 45.6 | 38.7 | 58.1 | 51.6 | 44.7 | 43.2 | 40.7 | 45.3 | 51.9 | 43.7 | 46.5 | 48.3 | 45.5 | 52.1 | 42.8 | 47.3 | 47.6 | ||
| [2002,2007) | 49.4 | 47.7 | 59.5 | 49.5 | 41.7 | 46.5 | 37.9 | 45.0 | 50.7 | 52.5 | 46.8 | 48.2 | 48.5 | 50.9 | 43.6 | 50.4 | 48.5 | ||
| [1997,2002) | 42.4 | 46.9 | 51.2 | 47.2 | 46.0 | 45.4 | 47.1 | 48.6 | 51.7 | 48.9 | 59.3 | 47.9 | 46.0 | 48.4 | 46.8 | 52.6 | 48.5 | ||
| [1992,1997) | 32.9 | 28.9 | 32.3 | 32.6 | 37.0 | 31.1 | 29.7 | 28.0 | 30.7 | 33.1 | 38.6 | 28.6 | 29.9 | 34.1 | 29.7 | 33.9 | 32.1 | ||
| [1987,1992) | 62.7 | 59.6 | 66.6 | 61.3 | 57.3 | 59.6 | 63.7 | 61.1 | 65.9 | 68.2 | 71.0 | 64.8 | 62.3 | 61.4 | 61.4 | 68.3 | 63.2 | ||
| Year | |||||||||||||||||||
| 2017 | 47.1 | 43.5 | 46.1 | 43.2 | 38.7 | 31.5 | 36.0 | 30.7 | 33.9 | 35.3 | 32.9 | 38.2 | 42.1 | 42.7 | 32.9 | 34.0 | 37.8 | ||
| 2016 | 49.1 | 44.5 | 48.6 | 46.1 | 42.0 | 42.3 | 39.0 | 39.4 | 44.2 | 44.3 | 45.6 | 49.7 | 47.6 | 45.9 | 40.1 | 44.6 | 44.3 | ||
| 2015 | 47.1 | 55.7 | 57.2 | 51.3 | 35.9 | 44.8 | 41.2 | 42.8 | 43.8 | 45.0 | 47.3 | 44.7 | 48.4 | 48.8 | 42.8 | 45.2 | 46.2 | ||
| 2014 | 47.3 | 48.3 | 54.3 | 51.8 | 51.1 | 54.1 | 40.1 | 41.5 | 52.7 | 54.2 | 44.9 | 48.8 | 48.3 | 52.4 | 43.4 | 51.4 | 48.7 | ||
| 2013 | 48.6 | 43.0 | 54.6 | 46.3 | 49.5 | 46.4 | 41.4 | 43.1 | 49.3 | 48.8 | 49.8 | 53.4 | 48.7 | 49.6 | 43.8 | 49.2 | 47.6 | ||
| 2012 | 47.8 | 43.7 | 47.9 | 44.1 | 35.2 | 45.3 | 35.9 | 32.7 | 47.0 | 42.1 | 42.8 | 47.0 | 46.2 | 43.0 | 38.4 | 44.1 | 42.7 | ||
| 2011 | 51.2 | 35.2 | 54.3 | 51.9 | 48.5 | 41.4 | 46.4 | 53.0 | 50.3 | 42.3 | 43.6 | 47.1 | 45.4 | 52.0 | 46.1 | 45.5 | 47.5 | ||
| 2010 | 47.9 | 37.7 | 53.6 | 50.1 | 45.0 | 42.2 | 41.5 | 38.8 | 59.4 | 34.0 | 52.9 | 46.9 | 44.9 | 49.9 | 41.4 | 48.2 | 46.8 | ||
| 2009 | 54.7 | 54.2 | 62.8 | 50.8 | 42.0 | 42.3 | 40.7 | 36.7 | 54.9 | 40.6 | 32.1 | 47.7 | 51.2 | 52.0 | 40.3 | 43.9 | 47.9 | ||
| 2008 | 40.7 | 41.7 | 65.9 | 50.9 | 45.0 | 47.7 | 50.0 | 46.3 | 52.2 | 53.7 | 48.6 | 50.0 | 45.1 | 54.0 | 48.0 | 52.3 | 50.9 | ||
| 2007 | 29.7 | 26.9 | 53.5 | 55.0 | 43.9 | 43.3 | 28.0 | 43.5 | 43.0 | 44.9 | 61.0 | 49.8 | 41.3 | 52.6 | 37.5 | 47.5 | 45.3 | ||
| 2006 | 48.7 | 48.5 | 52.9 | 57.3 | 40.5 | 44.1 | 40.4 | 45.9 | 49.9 | 46.8 | 37.7 | 51.7 | 50.2 | 52.4 | 43.3 | 46.5 | 48.5 | ||
| 2005 | 40.4 | 33.6 | 55.0 | 34.8 | 33.8 | 49.4 | 39.7 | 39.1 | 51.5 | 55.2 | 50.7 | 48.5 | 43.2 | 43.7 | 44.6 | 52.4 | 46.2 | ||
| 2004 | 48.4 | 52.0 | 62.5 | 50.6 | 38.4 | 41.0 | 37.0 | 29.3 | 47.7 | 47.3 | 45.6 | 39.9 | 46.9 | 51.3 | 37.2 | 47.1 | 45.9 | ||
| 2003 | 48.7 | 49.6 | 57.6 | 43.5 | 39.0 | 41.9 | 34.1 | 56.6 | 50.2 | 60.4 | 45.7 | 48.4 | 48.9 | 47.1 | 44.8 | 53.1 | 48.4 | ||
| 2002 | 58.9 | 51.7 | 72.1 | 51.9 | 54.5 | 52.2 | 37.7 | 44.1 | 54.5 | 51.2 | 55.3 | 50.0 | 53.7 | 59.1 | 46.8 | 53.5 | 53.2 | ||
| 2001 | 50.2 | 56.0 | 58.2 | 55.0 | 57.4 | 59.4 | 55.5 | 55.2 | 54.5 | 56.1 | 61.3 | 54.2 | 53.2 | 57.0 | 57.0 | 56.6 | 56.1 | ||
| 2000 | 50.8 | 61.4 | 63.7 | 56.8 | 55.6 | 43.1 | 46.7 | 48.1 | 54.3 | 54.4 | 59.1 | 60.2 | 58.1 | 58.7 | 45.7 | 55.2 | 53.8 | ||
| 1999 | 44.1 | 28.9 | 53.4 | 46.5 | 49.4 | 53.8 | 50.4 | 62.9 | 57.8 | 49.0 | 65.9 | 50.9 | 44.1 | 49.9 | 55.6 | 57.3 | 52.4 | ||
| 1998 | 24.3 | 34.0 | 35.8 | 22.8 | 26.5 | 19.8 | 33.8 | 20.8 | 30.1 | 28.2 | 48.1 | 25.3 | 27.9 | 29.0 | 24.2 | 32.7 | 28.2 | ||
| 1997 | 17.2 | 24.1 | 19.1 | 25.0 | 25.6 | 27.9 | 25.5 | 19.3 | 35.0 | 31.2 | 33.3 | 12.5 | 17.5 | 23.1 | 25.0 | 32.5 | 24.2 | ||
| 1996 | 28.4 | 20.2 | 36.0 | 27.2 | 28.7 | 25.3 | 25.2 | 21.2 | 21.6 | 29.7 | 24.1 | 29.9 | 25.8 | 30.0 | 24.0 | 24.6 | 26.2 | ||
| 1995 | 30.1 | 20.9 | 19.4 | 23.8 | 21.8 | 24.1 | 33.6 | 17.5 | 25.5 | 28.2 | 37.7 | 31.9 | 26.9 | 22.0 | 26.6 | 29.8 | 26.1 | ||
| 1994 | 37.3 | 35.1 | 47.1 | 48.8 | 47.8 | 39.1 | 32.4 | 32.8 | 21.6 | 29.0 | 32.5 | 23.6 | 30.9 | 47.9 | 34.3 | 27.8 | 35.6 | ||
| 1993 | 24.5 | 46.2 | 30.6 | 32.0 | 45.5 | 52.2 | 30.6 | 40.6 | 51.9 | 40.0 | 41.6 | 37.7 | 37.8 | 36.0 | 40.9 | 45.0 | 39.9 | ||
| 1992 | 44.6 | 29.6 | 34.1 | 40.4 | 44.4 | 28.6 | 25.9 | 41.5 | 38.0 | 49.2 | 53.9 | 18.3 | 31.3 | 39.4 | 30.9 | 47.1 | 37.8 | ||
| 1991 | 25.2 | 22.3 | 30.2 | 30.1 | 35.1 | 18.9 | 42.9 | 36.0 | 36.5 | 47.5 | 45.9 | 48.0 | 28.4 | 31.8 | 31.1 | 43.2 | 32.9 | ||
| 1990 | 66.5 | 55.7 | 46.2 | 29.6 | 35.5 | 45.8 | 50.0 | 39.4 | 46.6 | 46.4 | 50.7 | 43.4 | 57.5 | 36.9 | 45.1 | 47.8 | 48.0 | ||
| 1989 | 76.0 | 65.5 | 77.7 | 70.0 | 61.1 | 64.8 | 67.0 | 62.9 | 67.8 | 70.8 | 77.0 | 69.6 | 70.1 | 70.0 | 64.9 | 71.5 | 69.1 | ||
| 1988 | 69.4 | 70.5 | 74.2 | 67.2 | 62.6 | 67.2 | 69.8 | 69.7 | 78.7 | 75.9 | 79.8 | 76.3 | 71.9 | 67.1 | 68.9 | 78.2 | 71.3 | ||
| 1987 | 63.6 | 53.3 | 71.3 | 71.1 | 63.9 | 65.9 | 65.1 | 65.0 | 68.9 | 72.8 | 72.5 | 61.3 | 60.9 | 68.3 | 65.3 | 71.5 | 67.7 | ||
| 1986 | 57.7 | 55.3 | 49.1 | 58.3 | 59.6 | 38.2 | 43.5 | 47.2 | 58.1 | 70.6 | 62.1 | 51.4 | 54.5 | 55.1 | 43.0 | 64.9 | 54.9 | ||
| 1985 | 53.3 | 26.7 | 28.8 | 30.2 | 42.1 | 38.3 | 12.5 | 29.4 | 45.5 | 42.1 | 50.0 | 57.1 | 45.5 | 33.3 | 34.1 | 45.0 | 37.3 | ||
| 1984 | 0.0 | 0.0 | 0.0 | 0.0 | 0.0 | 0.0 | 55.2 | 21.2 | 70.4 | 26.5 | 45.2 | 17.6 | 12.2 | 0.0 | 31.1 | 45.7 | 30.1 | ||
| 1983 | 0.0 | 0.0 | 0.0 | 7.7 | 11.1 | 7.7 | 0.0 | 9.1 | 0.0 | - | 0.0 | 0.0 | 0.0 | 7.4 | 6.7 | 0.0 | 4.0 | ||
| 1982 | - | 0.0 | - | 0.0 | 0.0 | 0.0 | - | 0.0 | - | 0.0 | - | 0.0 | 0.0 | 0.0 | 0.0 | 0.0 | 0.0 | ||
Breeding data
Breeding records by month
Number of breeding records by breeding code and month, 2017 and all years| Breeding code | Jul | Aug | Sep | Oct | Nov | Dec | Jan | Feb | Mar | Apr | May | Jun |
|---|---|---|---|---|---|---|---|---|---|---|---|---|
| 2017 | ||||||||||||
| Breeding (BLA code) | 0 | 1 | 1 | 1 | 0 | 0 | 0 | 0 | 0 | 0 | 0 | 0 |
| Carrying Food | 0 | 0 | 0 | 0 | 0 | 0 | 0 | 0 | 0 | 0 | 0 | 0 |
| Copulating | 0 | 0 | 0 | 1 | 0 | 0 | 0 | 0 | 0 | 0 | 0 | 0 |
| Display | 0 | 0 | 0 | 2 | 1 | 0 | 0 | 0 | 0 | 0 | 1 | 0 |
| Dependent young | 0 | 0 | 0 | 3 | 0 | 5 | 16 | 3 | 0 | 0 | 0 | 0 |
| Faecal sac | 0 | 0 | 0 | 0 | 0 | 0 | 0 | 0 | 0 | 0 | 0 | 0 |
| Inspecting hollow | 4 | 6 | 8 | 15 | 2 | 2 | 1 | 0 | 0 | 0 | 0 | 0 |
| Nest building | 0 | 0 | 0 | 1 | 0 | 0 | 0 | 0 | 0 | 0 | 0 | 0 |
| Nest with eggs | 0 | 0 | 0 | 0 | 0 | 0 | 0 | 0 | 0 | 0 | 0 | 0 |
| Nest with young | 0 | 0 | 0 | 0 | 2 | 0 | 0 | 0 | 0 | 0 | 0 | 0 |
| On/leaving nest | 0 | 0 | 2 | 5 | 2 | 3 | 0 | 0 | 0 | 0 | 0 | 0 |
| All years | ||||||||||||
| Breeding (BLA code) | 0 | 3 | 1 | 5 | 5 | 6 | 9 | 2 | 0 | 0 | 0 | 0 |
| Carrying Food | 0 | 0 | 0 | 0 | 0 | 0 | 0 | 1 | 0 | 0 | 0 | 0 |
| Copulating | 0 | 0 | 1 | 7 | 4 | 1 | 0 | 0 | 0 | 0 | 0 | 0 |
| Display | 0 | 0 | 0 | 4 | 1 | 0 | 0 | 0 | 0 | 0 | 1 | 0 |
| Dependent young | 0 | 0 | 0 | 13 | 11 | 53 | 68 | 20 | 3 | 2 | 0 | 0 |
| Faecal sac | 0 | 0 | 0 | 0 | 0 | 0 | 0 | 0 | 0 | 0 | 0 | 0 |
| Inspecting hollow | 21 | 54 | 134 | 166 | 52 | 21 | 4 | 1 | 6 | 0 | 3 | 7 |
| Nest building | 0 | 4 | 6 | 15 | 9 | 3 | 2 | 0 | 1 | 0 | 0 | 0 |
| Nest with eggs | 0 | 0 | 2 | 3 | 4 | 1 | 0 | 0 | 0 | 0 | 0 | 0 |
| Nest with young | 0 | 0 | 1 | 11 | 9 | 4 | 5 | 0 | 0 | 0 | 0 | 0 |
| On/leaving nest | 0 | 1 | 20 | 72 | 21 | 6 | 0 | 0 | 1 | 0 | 0 | 0 |
Breeding records by year
Average number of breeding records per period by breeding code| Period | Breeding (BLA code) | Carrying Food | Copulating | Display | Dependent young | Faecal sac | Inspecting hollow | Nest building | Nest with eggs | Nest with young | On/leaving nest |
|---|---|---|---|---|---|---|---|---|---|---|---|
| All years | |||||||||||
| All | 0.9 | 0.0 | 0.4 | 0.2 | 4.7 | 0.0 | 13.0 | 1.1 | 0.3 | 0.8 | 3.4 |
| Previous years | |||||||||||
| All previous years | 0.8 | 0.0 | 0.3 | 0.1 | 4.1 | 0.0 | 12.3 | 1.1 | 0.3 | 0.8 | 3.1 |
| Previous 30 years | 0.9 | 0.0 | 0.4 | 0.1 | 4.7 | 0.0 | 14.4 | 1.3 | 0.3 | 0.9 | 3.6 |
| Previous 20 years | 1.4 | 0.0 | 0.6 | 0.1 | 3.4 | 0.0 | 20.0 | 0.1 | 0.1 | 0.9 | 5.3 |
| 10 year groups | |||||||||||
| [2007,2017) | 1.4 | 0.0 | 1.1 | 0.2 | 5.8 | 0.0 | 26.3 | 0.2 | 0.3 | 1.5 | 8.2 |
| [1997,2007) | 1.4 | 0.0 | 0.0 | 0.0 | 1.0 | 0.0 | 13.7 | 0.0 | 0.0 | 0.3 | 2.5 |
| [1987,1997) | 0.0 | 0.1 | 0.1 | 0.0 | 7.4 | 0.0 | 3.1 | 3.7 | 0.7 | 1.0 | 0.2 |
| 5 year groups | |||||||||||
| [2012,2017) | 1.2 | 0.0 | 0.8 | 0.4 | 7.6 | 0.0 | 29.2 | 0.4 | 0.0 | 2.0 | 8.2 |
| [2007,2012) | 1.6 | 0.0 | 1.4 | 0.0 | 4.0 | 0.0 | 23.4 | 0.0 | 0.6 | 1.0 | 8.2 |
| [2002,2007) | 0.8 | 0.0 | 0.0 | 0.0 | 1.0 | 0.0 | 17.0 | 0.0 | 0.0 | 0.0 | 3.6 |
| [1997,2002) | 2.0 | 0.0 | 0.0 | 0.0 | 1.0 | 0.0 | 10.4 | 0.0 | 0.0 | 0.6 | 1.4 |
| [1992,1997) | 0.0 | 0.0 | 0.2 | 0.0 | 2.8 | 0.0 | 5.6 | 0.0 | 0.0 | 0.4 | 0.4 |
| [1987,1992) | 0.0 | 0.2 | 0.0 | 0.0 | 12.0 | 0.0 | 0.6 | 7.4 | 1.4 | 1.6 | 0.0 |
| Year | |||||||||||
| 2017 | 3.0 | 0.0 | 1.0 | 4.0 | 27.0 | 0.0 | 38.0 | 1.0 | 0.0 | 2.0 | 12.0 |
| 2016 | 0.0 | 0.0 | 0.0 | 0.0 | 8.0 | 0.0 | 40.0 | 0.0 | 0.0 | 2.0 | 15.0 |
| 2015 | 0.0 | 0.0 | 1.0 | 1.0 | 18.0 | 0.0 | 25.0 | 1.0 | 0.0 | 3.0 | 11.0 |
| 2014 | 0.0 | 0.0 | 1.0 | 1.0 | 6.0 | 0.0 | 24.0 | 0.0 | 0.0 | 3.0 | 4.0 |
| 2013 | 2.0 | 0.0 | 1.0 | 0.0 | 2.0 | 0.0 | 29.0 | 1.0 | 0.0 | 2.0 | 2.0 |
| 2012 | 4.0 | 0.0 | 1.0 | 0.0 | 4.0 | 0.0 | 28.0 | 0.0 | 0.0 | 0.0 | 9.0 |
| 2011 | 1.0 | 0.0 | 1.0 | 0.0 | 7.0 | 0.0 | 20.0 | 0.0 | 0.0 | 0.0 | 9.0 |
| 2010 | 2.0 | 0.0 | 0.0 | 0.0 | 2.0 | 0.0 | 28.0 | 0.0 | 1.0 | 2.0 | 12.0 |
| 2009 | 1.0 | 0.0 | 3.0 | 0.0 | 2.0 | 0.0 | 29.0 | 0.0 | 0.0 | 0.0 | 7.0 |
| 2008 | 1.0 | 0.0 | 2.0 | 0.0 | 6.0 | 0.0 | 31.0 | 0.0 | 2.0 | 2.0 | 11.0 |
| 2007 | 3.0 | 0.0 | 1.0 | 0.0 | 3.0 | 0.0 | 9.0 | 0.0 | 0.0 | 1.0 | 2.0 |
| 2006 | 1.0 | 0.0 | 0.0 | 0.0 | 3.0 | 0.0 | 25.0 | 0.0 | 0.0 | 0.0 | 5.0 |
| 2005 | 0.0 | 0.0 | 0.0 | 0.0 | 1.0 | 0.0 | 15.0 | 0.0 | 0.0 | 0.0 | 2.0 |
| 2004 | 1.0 | 0.0 | 0.0 | 0.0 | 0.0 | 0.0 | 19.0 | 0.0 | 0.0 | 0.0 | 2.0 |
| 2003 | 2.0 | 0.0 | 0.0 | 0.0 | 1.0 | 0.0 | 14.0 | 0.0 | 0.0 | 0.0 | 7.0 |
| 2002 | 0.0 | 0.0 | 0.0 | 0.0 | 0.0 | 0.0 | 12.0 | 0.0 | 0.0 | 0.0 | 2.0 |
| 2001 | 2.0 | 0.0 | 0.0 | 0.0 | 3.0 | 0.0 | 13.0 | 0.0 | 0.0 | 2.0 | 0.0 |
| 2000 | 4.0 | 0.0 | 0.0 | 0.0 | 1.0 | 0.0 | 14.0 | 0.0 | 0.0 | 0.0 | 2.0 |
| 1999 | 4.0 | 0.0 | 0.0 | 0.0 | 0.0 | 0.0 | 12.0 | 0.0 | 0.0 | 1.0 | 0.0 |
| 1998 | 0.0 | 0.0 | 0.0 | 0.0 | 0.0 | 0.0 | 11.0 | 0.0 | 0.0 | 0.0 | 2.0 |
| 1997 | 0.0 | 0.0 | 0.0 | 0.0 | 1.0 | 0.0 | 2.0 | 0.0 | 0.0 | 0.0 | 3.0 |
| 1996 | 0.0 | 0.0 | 0.0 | 0.0 | 2.0 | 0.0 | 9.0 | 0.0 | 0.0 | 0.0 | 0.0 |
| 1995 | 0.0 | 0.0 | 0.0 | 0.0 | 4.0 | 0.0 | 7.0 | 0.0 | 0.0 | 0.0 | 1.0 |
| 1994 | 0.0 | 0.0 | 1.0 | 0.0 | 4.0 | 0.0 | 4.0 | 0.0 | 0.0 | 0.0 | 1.0 |
| 1993 | 0.0 | 0.0 | 0.0 | 0.0 | 3.0 | 0.0 | 5.0 | 0.0 | 0.0 | 2.0 | 0.0 |
| 1992 | 0.0 | 0.0 | 0.0 | 0.0 | 1.0 | 0.0 | 3.0 | 0.0 | 0.0 | 0.0 | 0.0 |
| 1991 | 0.0 | 0.0 | 0.0 | 0.0 | 0.0 | 0.0 | 2.0 | 0.0 | 0.0 | 1.0 | 0.0 |
| 1990 | 0.0 | 0.0 | 0.0 | 0.0 | 4.0 | 0.0 | 0.0 | 1.0 | 0.0 | 0.0 | 0.0 |
| 1989 | 0.0 | 1.0 | 0.0 | 0.0 | 17.0 | 0.0 | 1.0 | 19.0 | 2.0 | 3.0 | 0.0 |
| 1988 | 0.0 | 0.0 | 0.0 | 0.0 | 18.0 | 0.0 | 0.0 | 6.0 | 1.0 | 2.0 | 0.0 |
| 1987 | 0.0 | 0.0 | 0.0 | 0.0 | 21.0 | 0.0 | 0.0 | 11.0 | 4.0 | 2.0 | 0.0 |
| 1986 | 0.0 | 0.0 | 0.0 | 0.0 | 0.0 | 0.0 | 0.0 | 0.0 | 0.0 | 0.0 | 0.0 |
| 1985 | 0.0 | 0.0 | 0.0 | 0.0 | 0.0 | 0.0 | 0.0 | 0.0 | 0.0 | 0.0 | 0.0 |
| 1984 | 0.0 | 0.0 | 0.0 | 0.0 | 1.0 | 0.0 | 0.0 | 0.0 | 0.0 | 0.0 | 0.0 |
| 1983 | 0.0 | 0.0 | 0.0 | 0.0 | 0.0 | 0.0 | 0.0 | 0.0 | 0.0 | 0.0 | 0.0 |
| 1982 | 0.0 | 0.0 | 0.0 | 0.0 | 0.0 | 0.0 | 0.0 | 0.0 | 0.0 | 0.0 | 0.0 |
Distribution map
Distribution - 2017
This map shows the observed distribution of the Crimson Rosella for 2017.
The red circles are the grid cells where Crimson Rosella have been reported.
The transparency of the red circles indicate how many surveys sheets were submitted for that grid cell; the darker the red the more reliable the data. Of the 315 grid cells with reports, 83 had only one sheet; an example is grid number A9.
The size of the circle represents the reporting rate. The maximum reporting rate for Crimson Rosella was 100.0% (eg grid number A9) and the minimum was 3.3% (eg grid number S13). 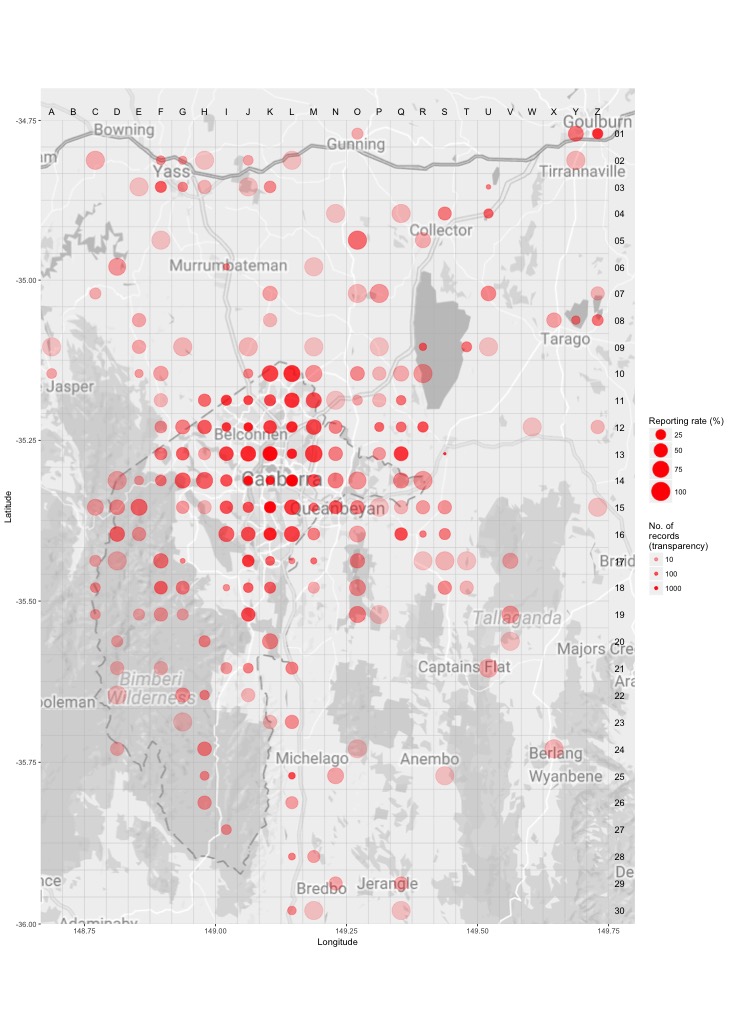
Distribution - all years
This map shows the observed distribution of the Crimson Rosella for all years.
The red circles are the grid cells where Crimson Rosella have been reported.
The transparency of the red circles indicate how many surveys sheets were submitted for that grid cell; the darker the red the more reliable the data. Of the 703 grid cells with reports, 55 had only one sheet; an example is grid number A12.
The size of the circle represents the reporting rate. The maximum reporting rate for Crimson Rosella was 100.0% (eg grid number A12) and the minimum was 3.9% (eg grid number S13). 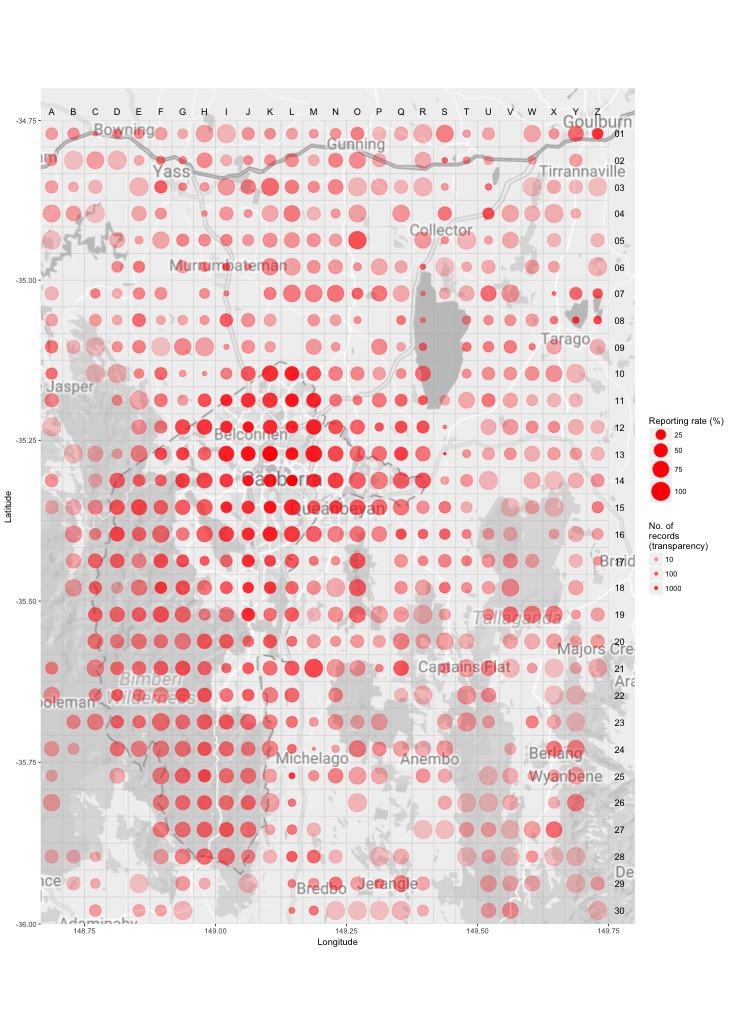
Breeding map
Breeding - 2017
This map shows the breeding distribution of the Crimson Rosella for 2017.
The red circles are the grid cells where breeding activity for Crimson Rosella have been reported.
The size of the circle represents the number of reports. 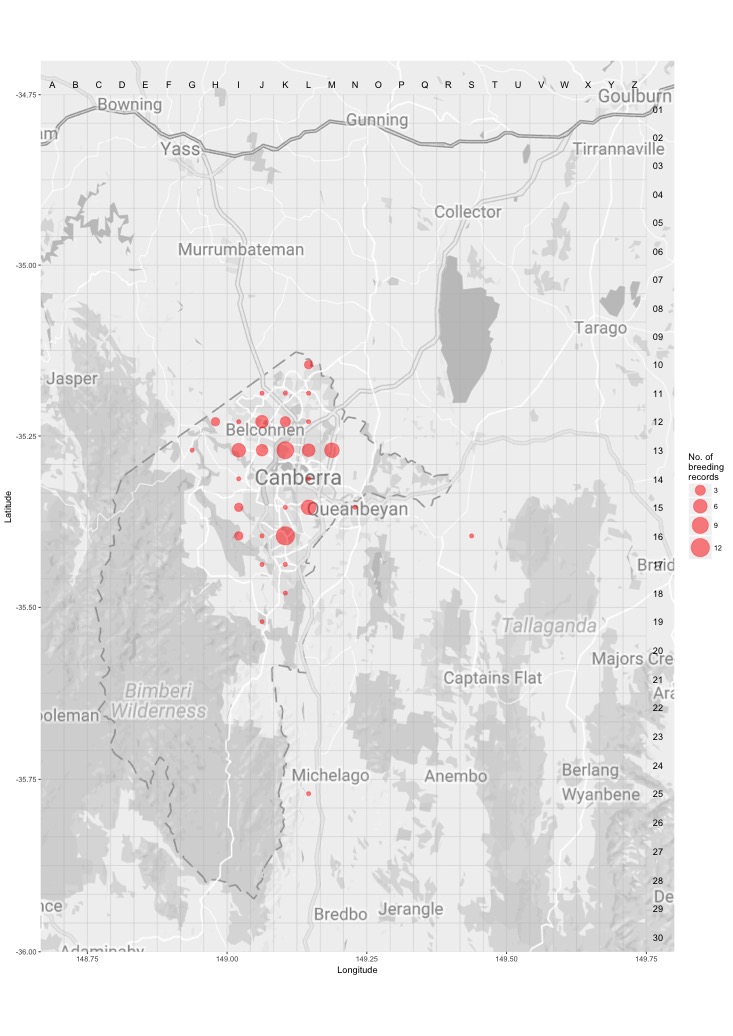
Breeding - all years
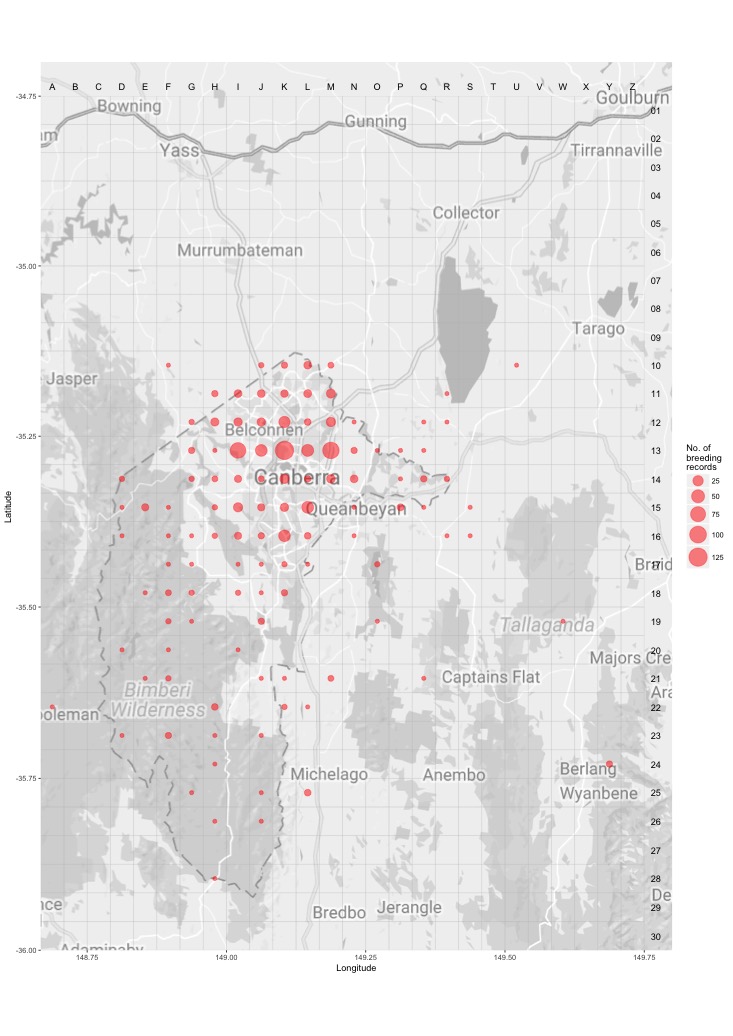
This map shows the breeding distribution of the Crimson Rosella for all years.
The red circles are the grid cells where breeding activity for Crimson Rosella have been reported.
The size of the circle represents the number of reports.